
Inside Java
News and views from members of the Java team at Oracle
News and views from members of the Java team at Oracle
The work presented here is performed as part of the joint research project between Oracle, Uppsala University and KTH. Follow the blog series here at inside.java to read more about the JVM research performed at the Oracle Development office in Stockholm.
My name is Marina Shimchenko, and I am currently pursuing my PhD in Computer Science at Uppsala University. Throughout my doctoral studies, I have had the incredible opportunity to collaborate with Oracle engineers from Stockholm. This collaboration between my research group and Oracle has been instrumental in expanding my knowledge and expertise in my field of study. The project that I am about to present is one of the fruits of this fruitful collaboration
Effective heap size management is crucial for optimizing memory utilization and performance in Java applications. However, manual configuration of heap size limits presents challenges. First, it is time-consuming and inefficient but also struggles to account for dynamic changes in memory usage. In this blog post, we introduce an innovative automated strategy for heap sizing in ZGC, leveraging CPU utilization as a "tuning knob" to optimize performance and memory usage.
Determining the ideal heap size is complex, especially considering varying parameters like hardware configurations. Our research reveals that heap sizes vary between machines without a discernible pattern, even within the same machine with different core configurations. These variations necessitate significant changes in heap sizes, highlighting the limitations of manual heap sizing.
Our approach to heap sizing is based on CPU utilization. Instead of controlling how much GC an application should do by setting the heap size, we task the GC to use CPU, proportional (user defined) to the application’s CPU usage. Thus, if the application's CPU usage increases — and thus typically its allocation rate — so does the target CPU for GC.
Implementing adaptive heap sizing in ZGC leverages the existing soft max heap size limit. This limit triggers garbage collection without causing stalls until it reaches the Xmx (maximum heap) parameter. At the end of each garbage collection cycle, the softmax heap is adjusted to meet the target GC CPU overhead set by the programmer. The GC CPU overhead is measured by comparing the time spent by application threads and GC threads (see Figure 1). We implemented adaptive heap sizing in ZGC due to its unique nature as a fully concurrent garbage collector. With ZGC, garbage collection pauses are extremely small and the collector is never on the critical path. This allows us to confidently size down the heap without any significant impact on latency.
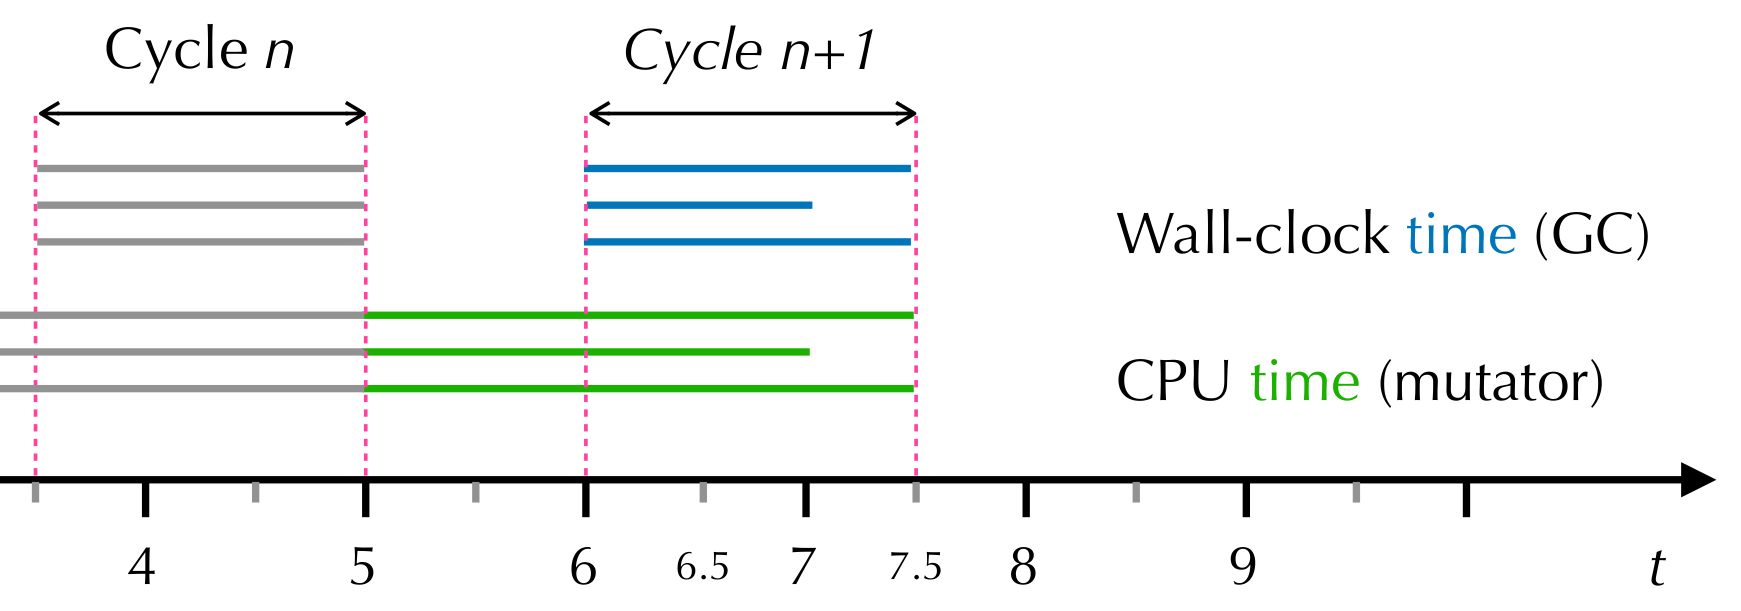
Caption for Figure 1. Concrete measurements of GC and application time in our implementation. At the end of the GC cycle n+1 (t=7.5), we consider the time spent in GC threads (blue) and the time spent in mutators (green). Gray lines denote time measured at the end of GC cycle n. We only include the time when mutators were scheduled, meaning application time=2.5+2+2.5=7. In the case of GC Time, we measure from the start to the finish of the GC cycle. Thus, GC Time=3* 1.5=4.5, even though the 2nd GC thread was not scheduled after t=7. Thus, GC CPU overhead=4.5/7=~64%. (This is unusually high — in most applications, GC accounts for less than 5%.)
To evaluate the impact of automated heap adjustment, we conducted tests with multiple GC targets (5%, 10%, 15%, and 20%) across various benchmarks. Adjusting the GC target significantly affects memory usage, with higher targets decreasing the application’s memory usage and lower targets increasing it. Execution time is generally not affected, but specific benchmarks may show improvements or degradation. The relationship between memory usage and energy consumption is complex, with higher GC targets increasing energy consumption due to higher CPU usage. However, in overcommitted CPU environments, reducing memory usage can lead to lower energy consumption. The adaptive approach has a positive or neutral impact on latency, reducing it in CPU-intensive workloads.
Our automated heap sizing strategy offers a proactive solution to the challenges of manual heap sizing. By empowering developers with control over CPU utilization for garbage collection, we eliminate the need to track memory usage patterns and determine heap sizes manually. This approach leads to reduced memory waste and a streamlined development experience. By embracing automated heap sizing, developers can unlock the full potential of their applications while enjoying simplified memory management.