
Inside Java
News and views from members of the Java team at Oracle
News and views from members of the Java team at Oracle
Have issues with unusually high CPU load in your Java applications? If you are on JDK 11 or above, JFR can help you track down what is consuming your CPU! Let's take a look!
JDK Flight Recorder, commonly called JFR, is an observability and monitoring framework built directly into the JDK! Since JDK 11, when JFR was open-sourced and renamed to JDK Flight Recorder (formerly Java), it has also been free to use in production. This makes JFR an excellent choice for tracking down the sneaky issues of why an application is hogging resources like CPU.
The first step is to capture a recording of an application. Luckily, because JFR is built into the JDK, it can be started on an already-running application! This is great for when you are seeing a sudden spike in resource usage but want to capture what might be going wrong before restarting the application.
To start recording an application, you will use the jcmd command:
$ jcmd <pid> JFR.start
You will need the PID of the JVM you want to monitor. Which can be found with jps.
JFR.start can take a number of optional arguments, like name if you want to start a separate recording from another you already have running.
Next, we need to get the recording data from the application with JFR.dump.
$ jcmd <pid> JFR.dump [filename={path}]
The argument filename is optional but highly recommended to give a more memorable name than the default provided by JFR. The path of filename is relative to the path of the JVM being monitored, not the directory jcmd is executed from.
JFR can also be initialized at startup with:
$ java -XX:StartFlightRecording[=args]
Which can take several args, be sure to check the Additional Reading section for me.
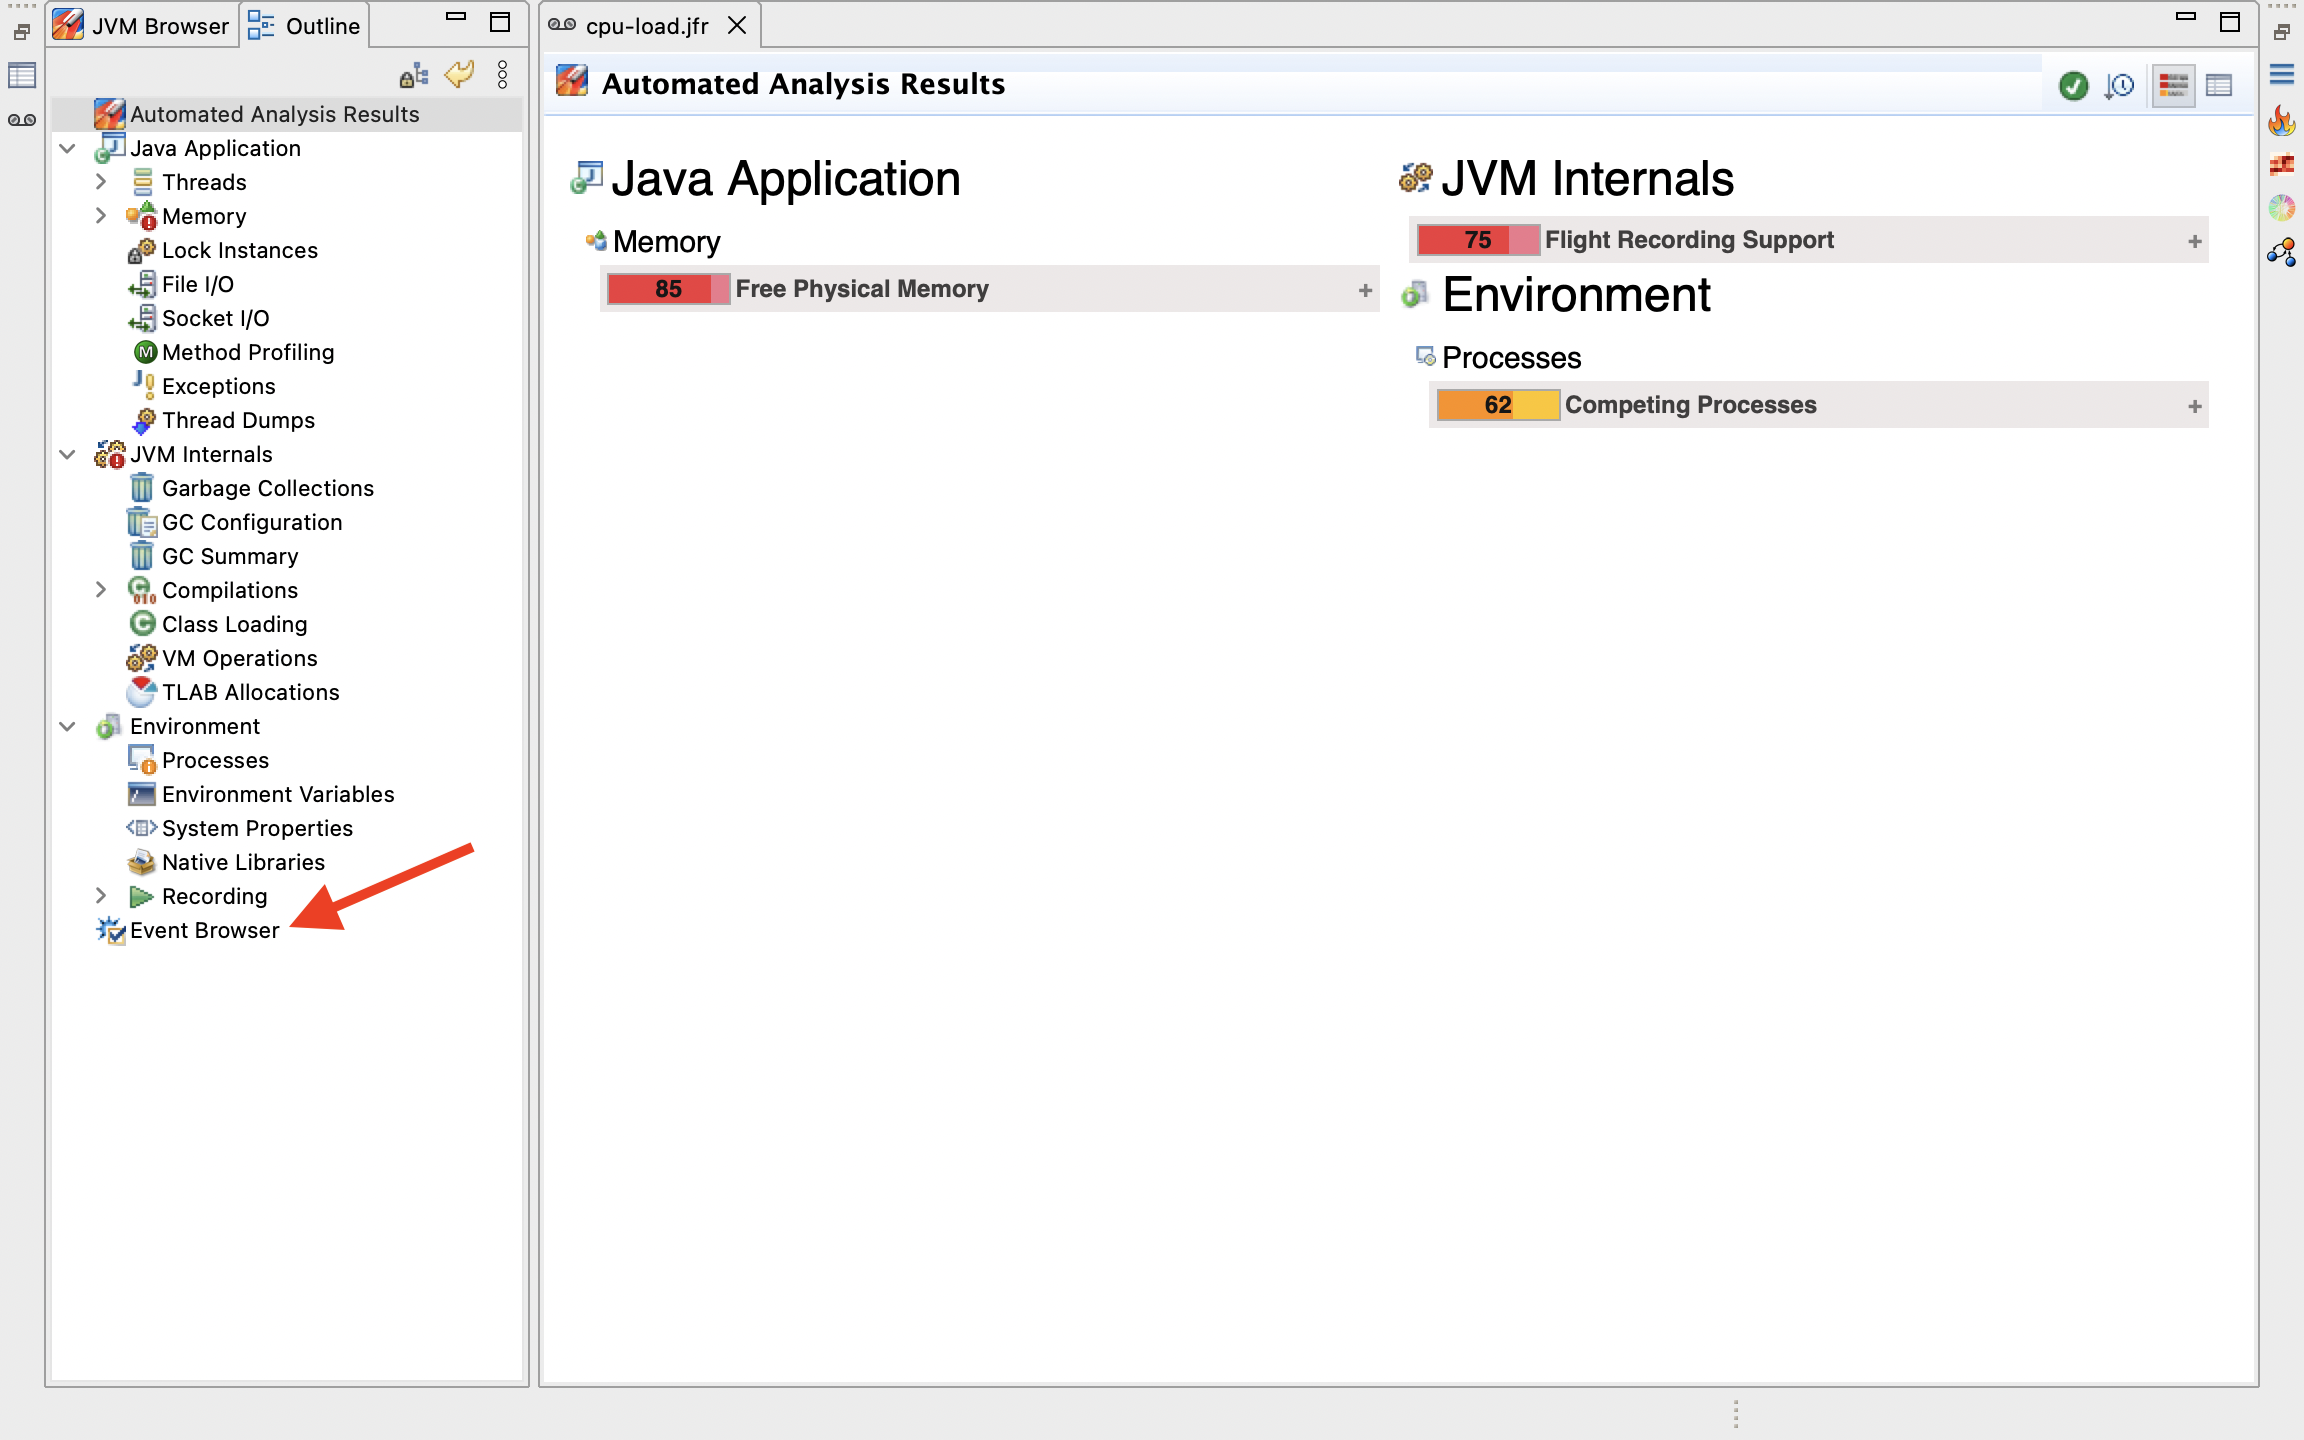
JDK Mission Control (JMC) is an open-source tool for analyzing JFR recordings. Open the JFR Recording we just captured in JMC and go to Event Browser on the bottom left of the page.
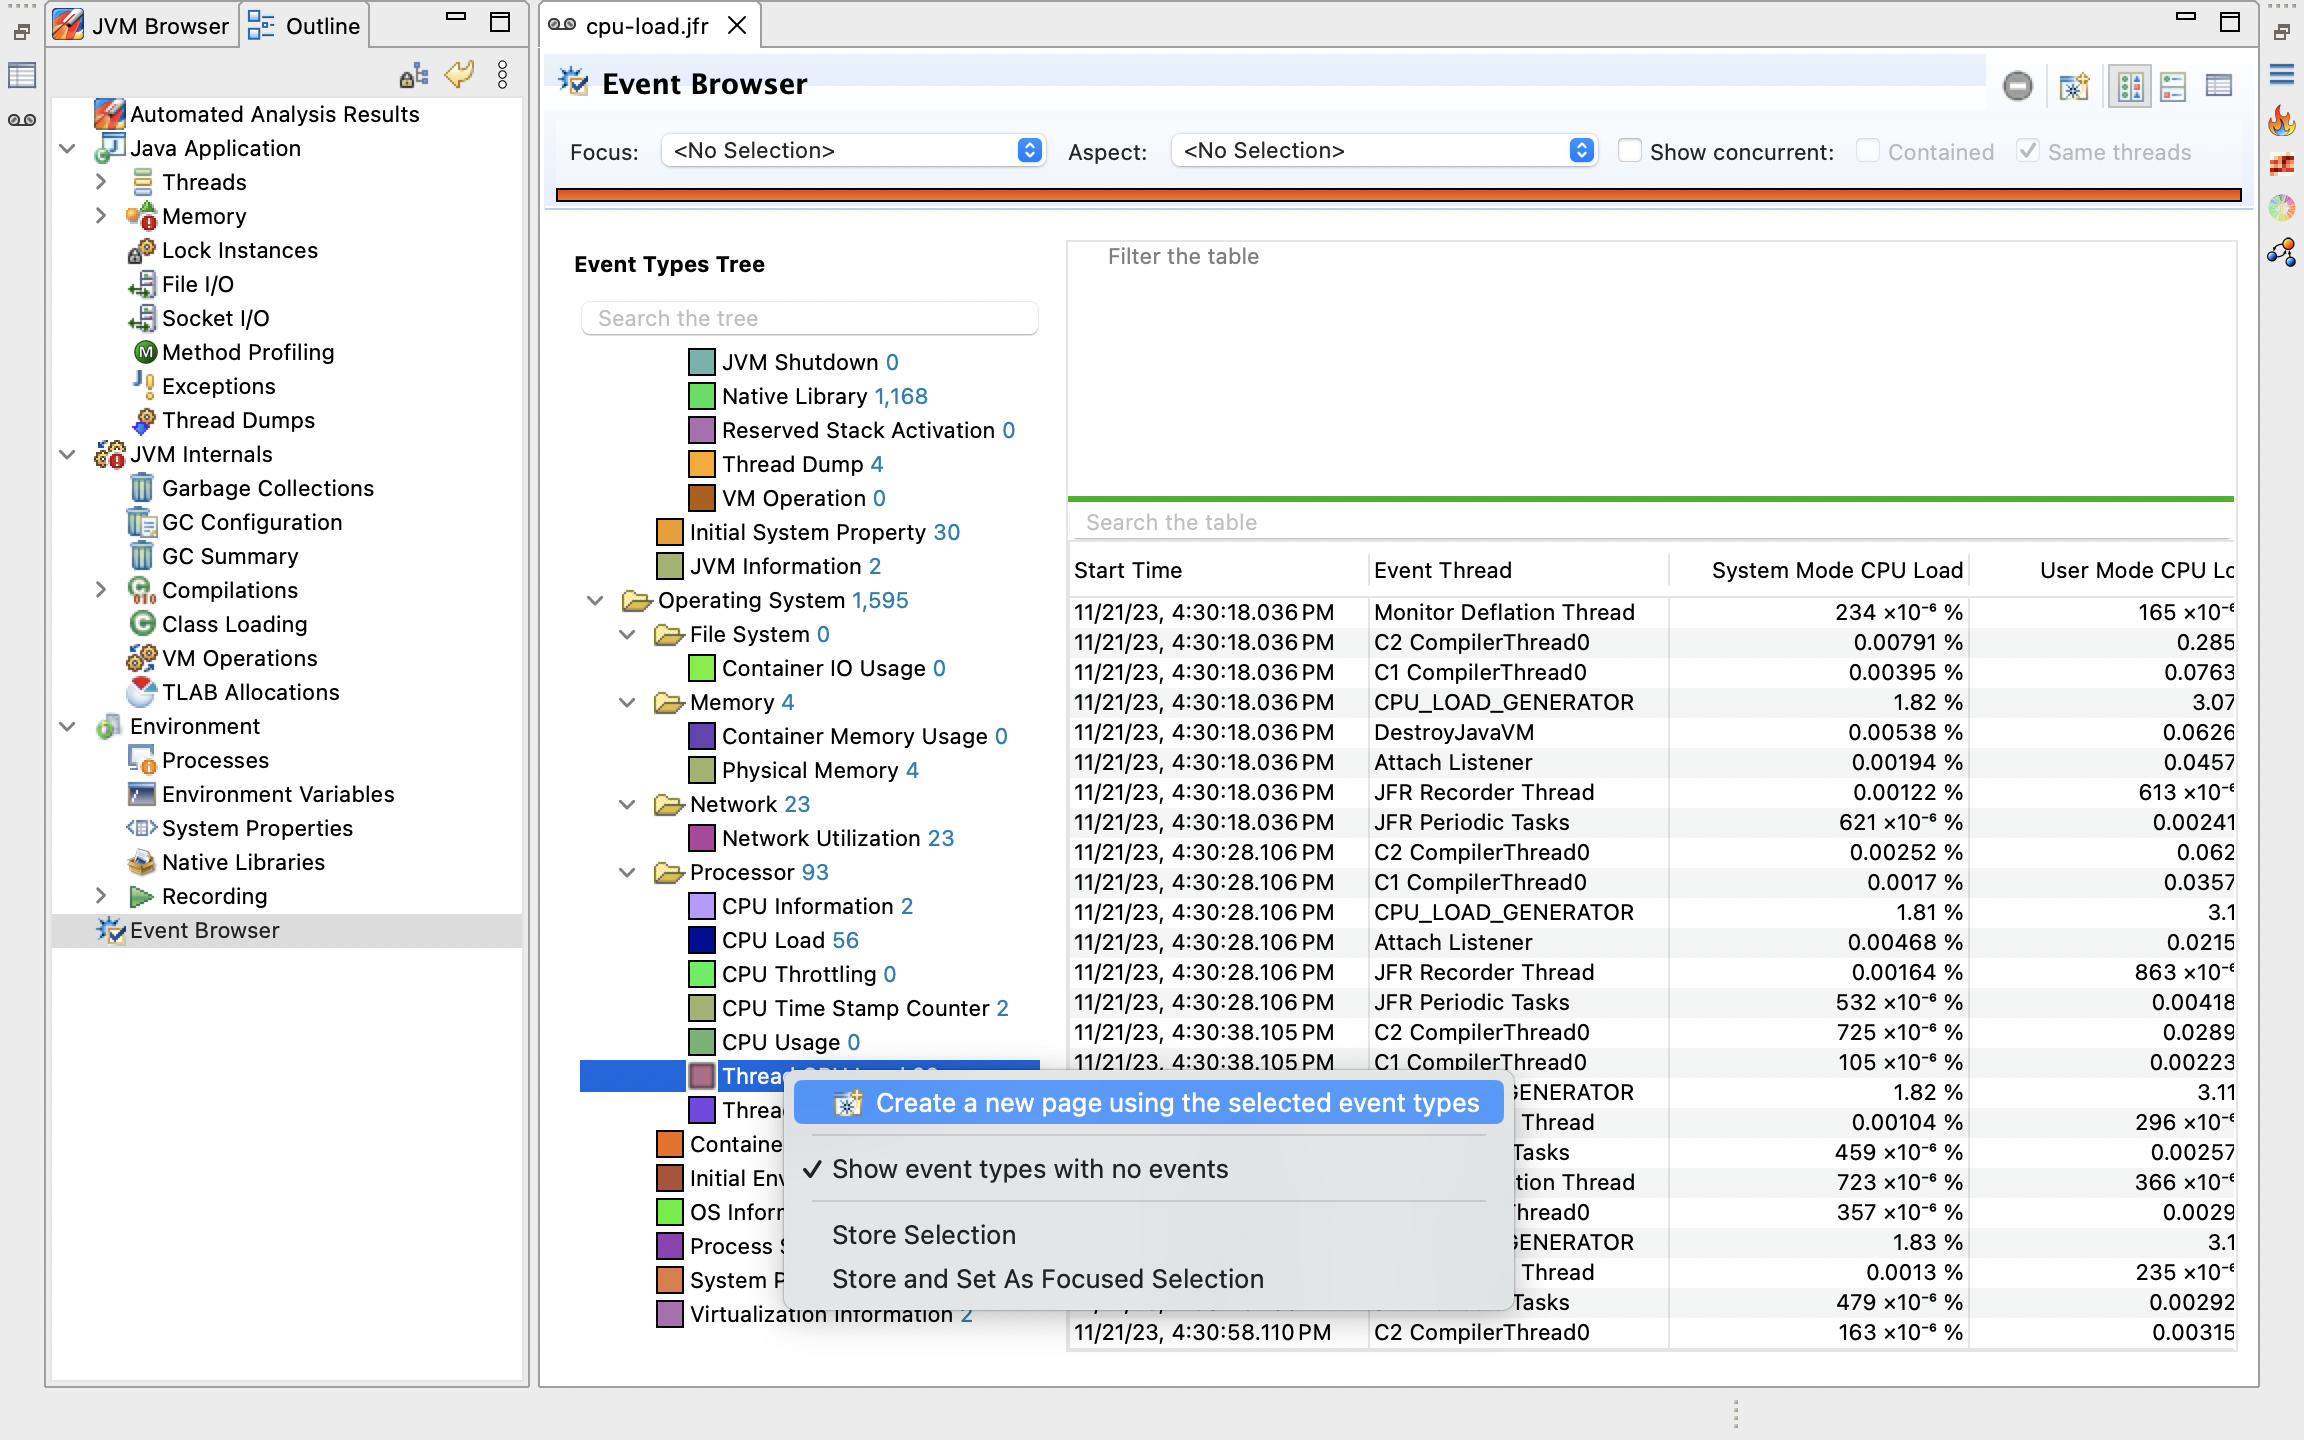
On the Event Browser page, scroll to near the bottom to under the Processor folder, to Thread CPU Load event (newly added in JDK 11), right-click, and select "Create a new page using the selected event types".
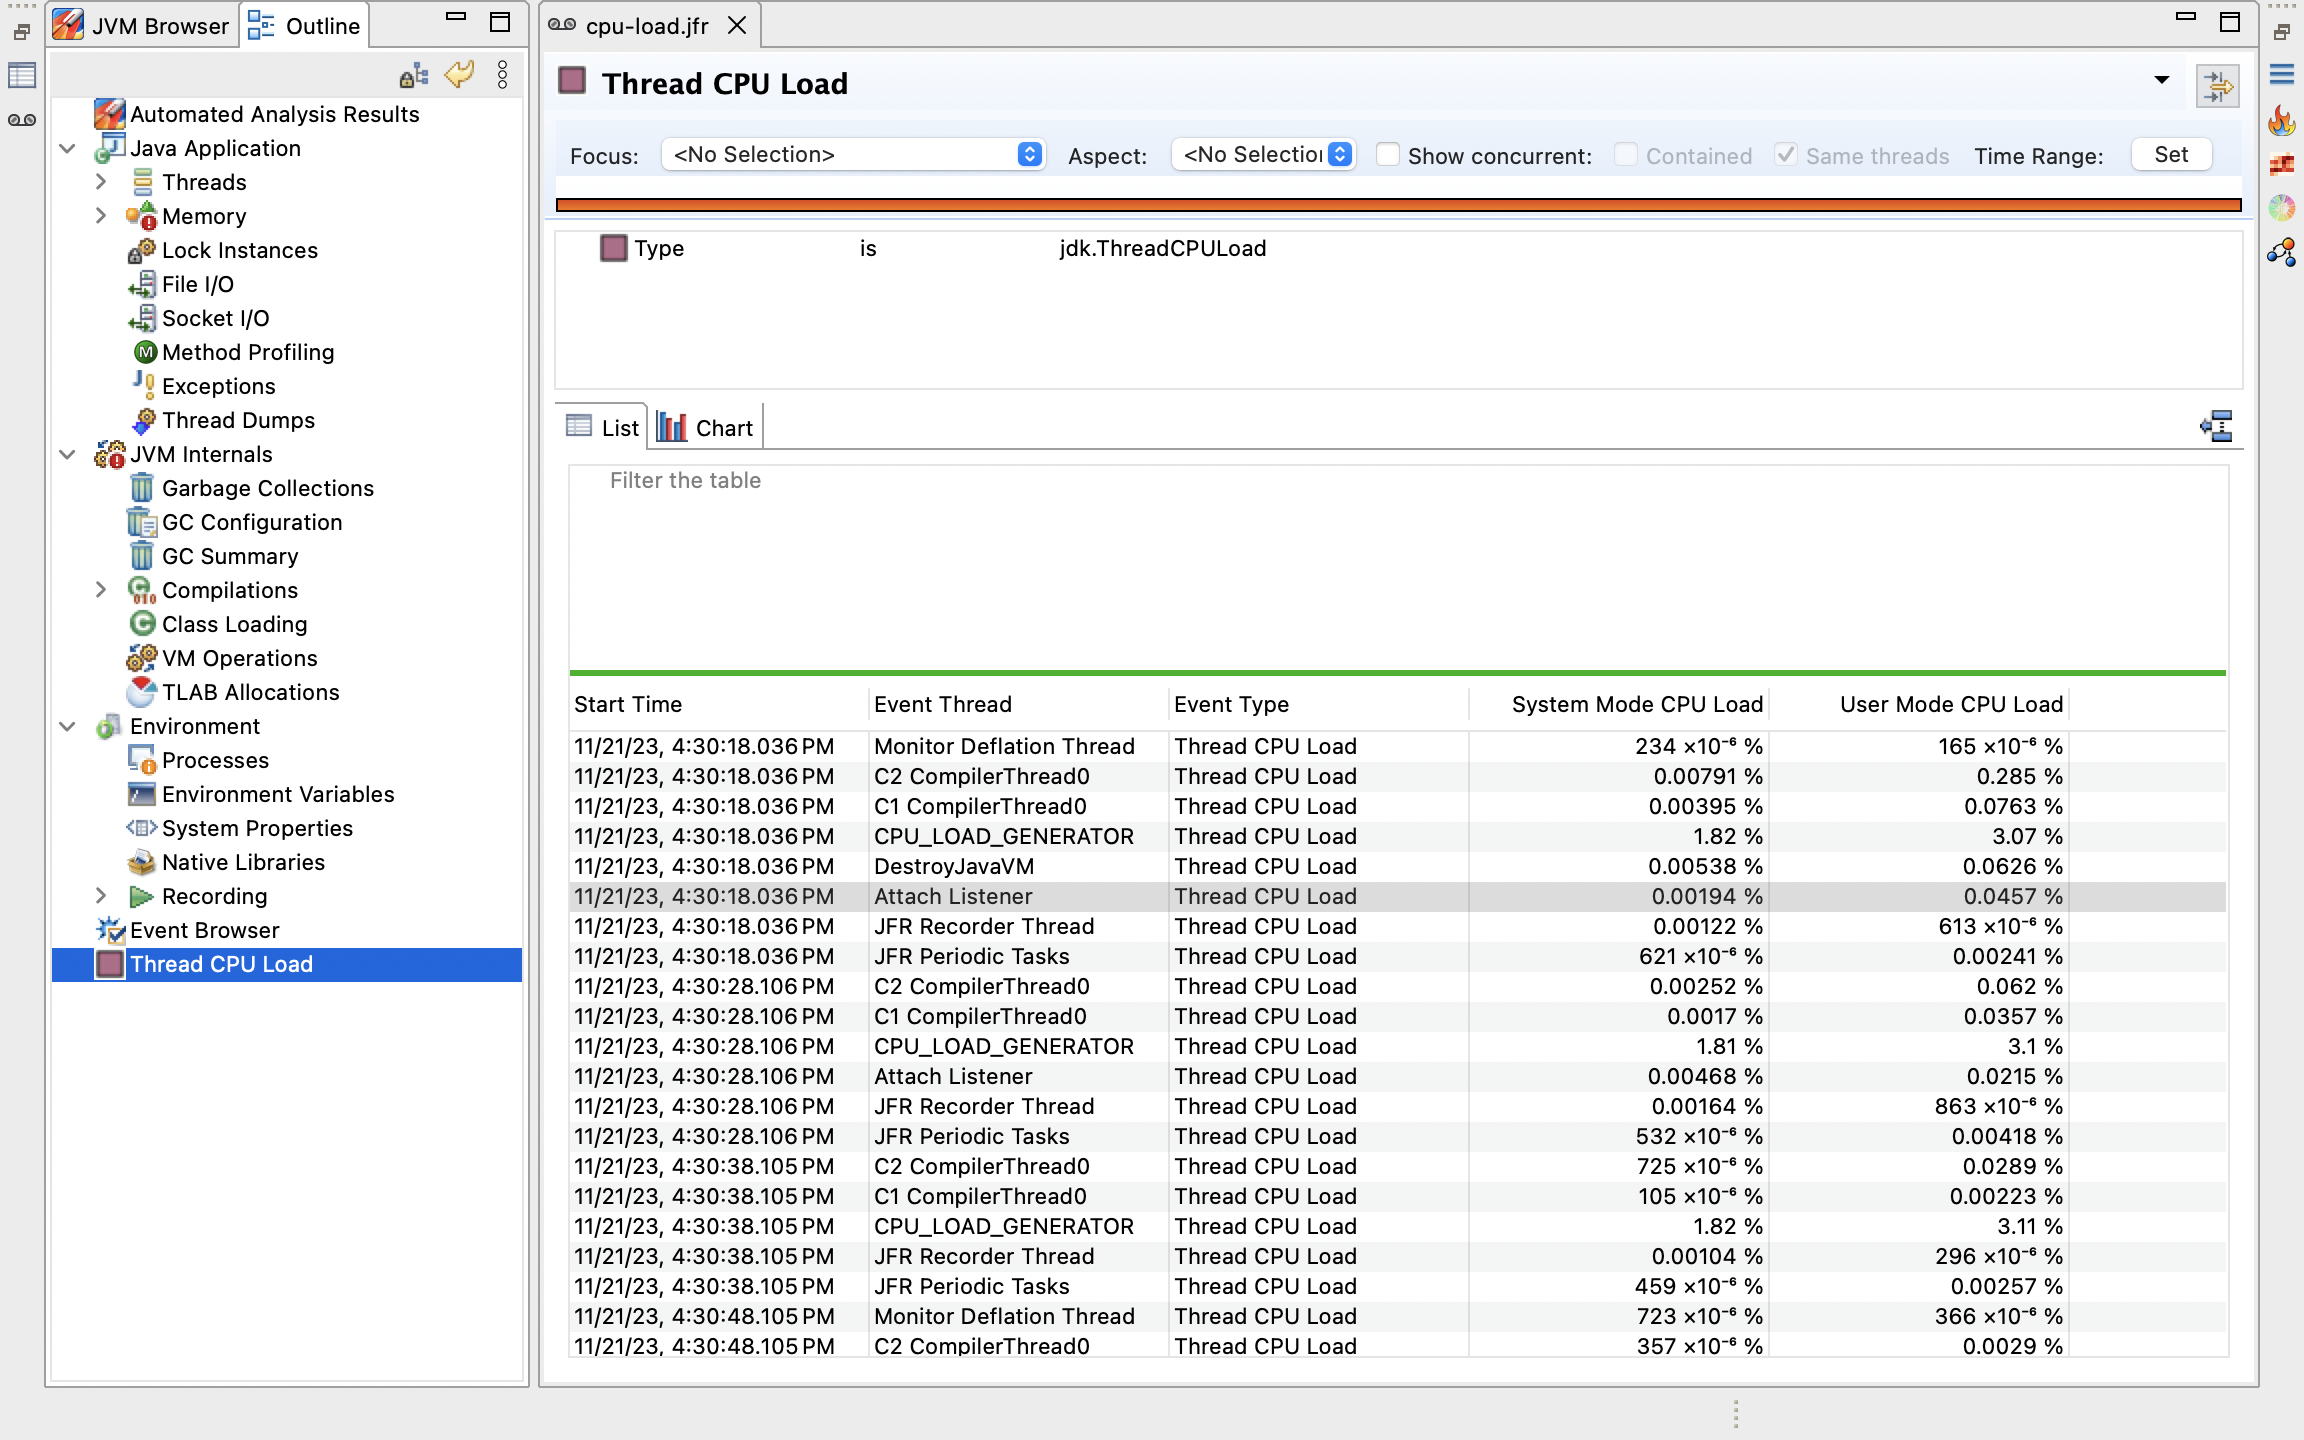
Open the newly created Thread CPU Load page that should be available under Event Browser on the bottom left of the screen.
For easier readability, group the events by Event Thread by right-clicking anywhere in the event listing and selecting Group By and Event Thread in the drop-down.
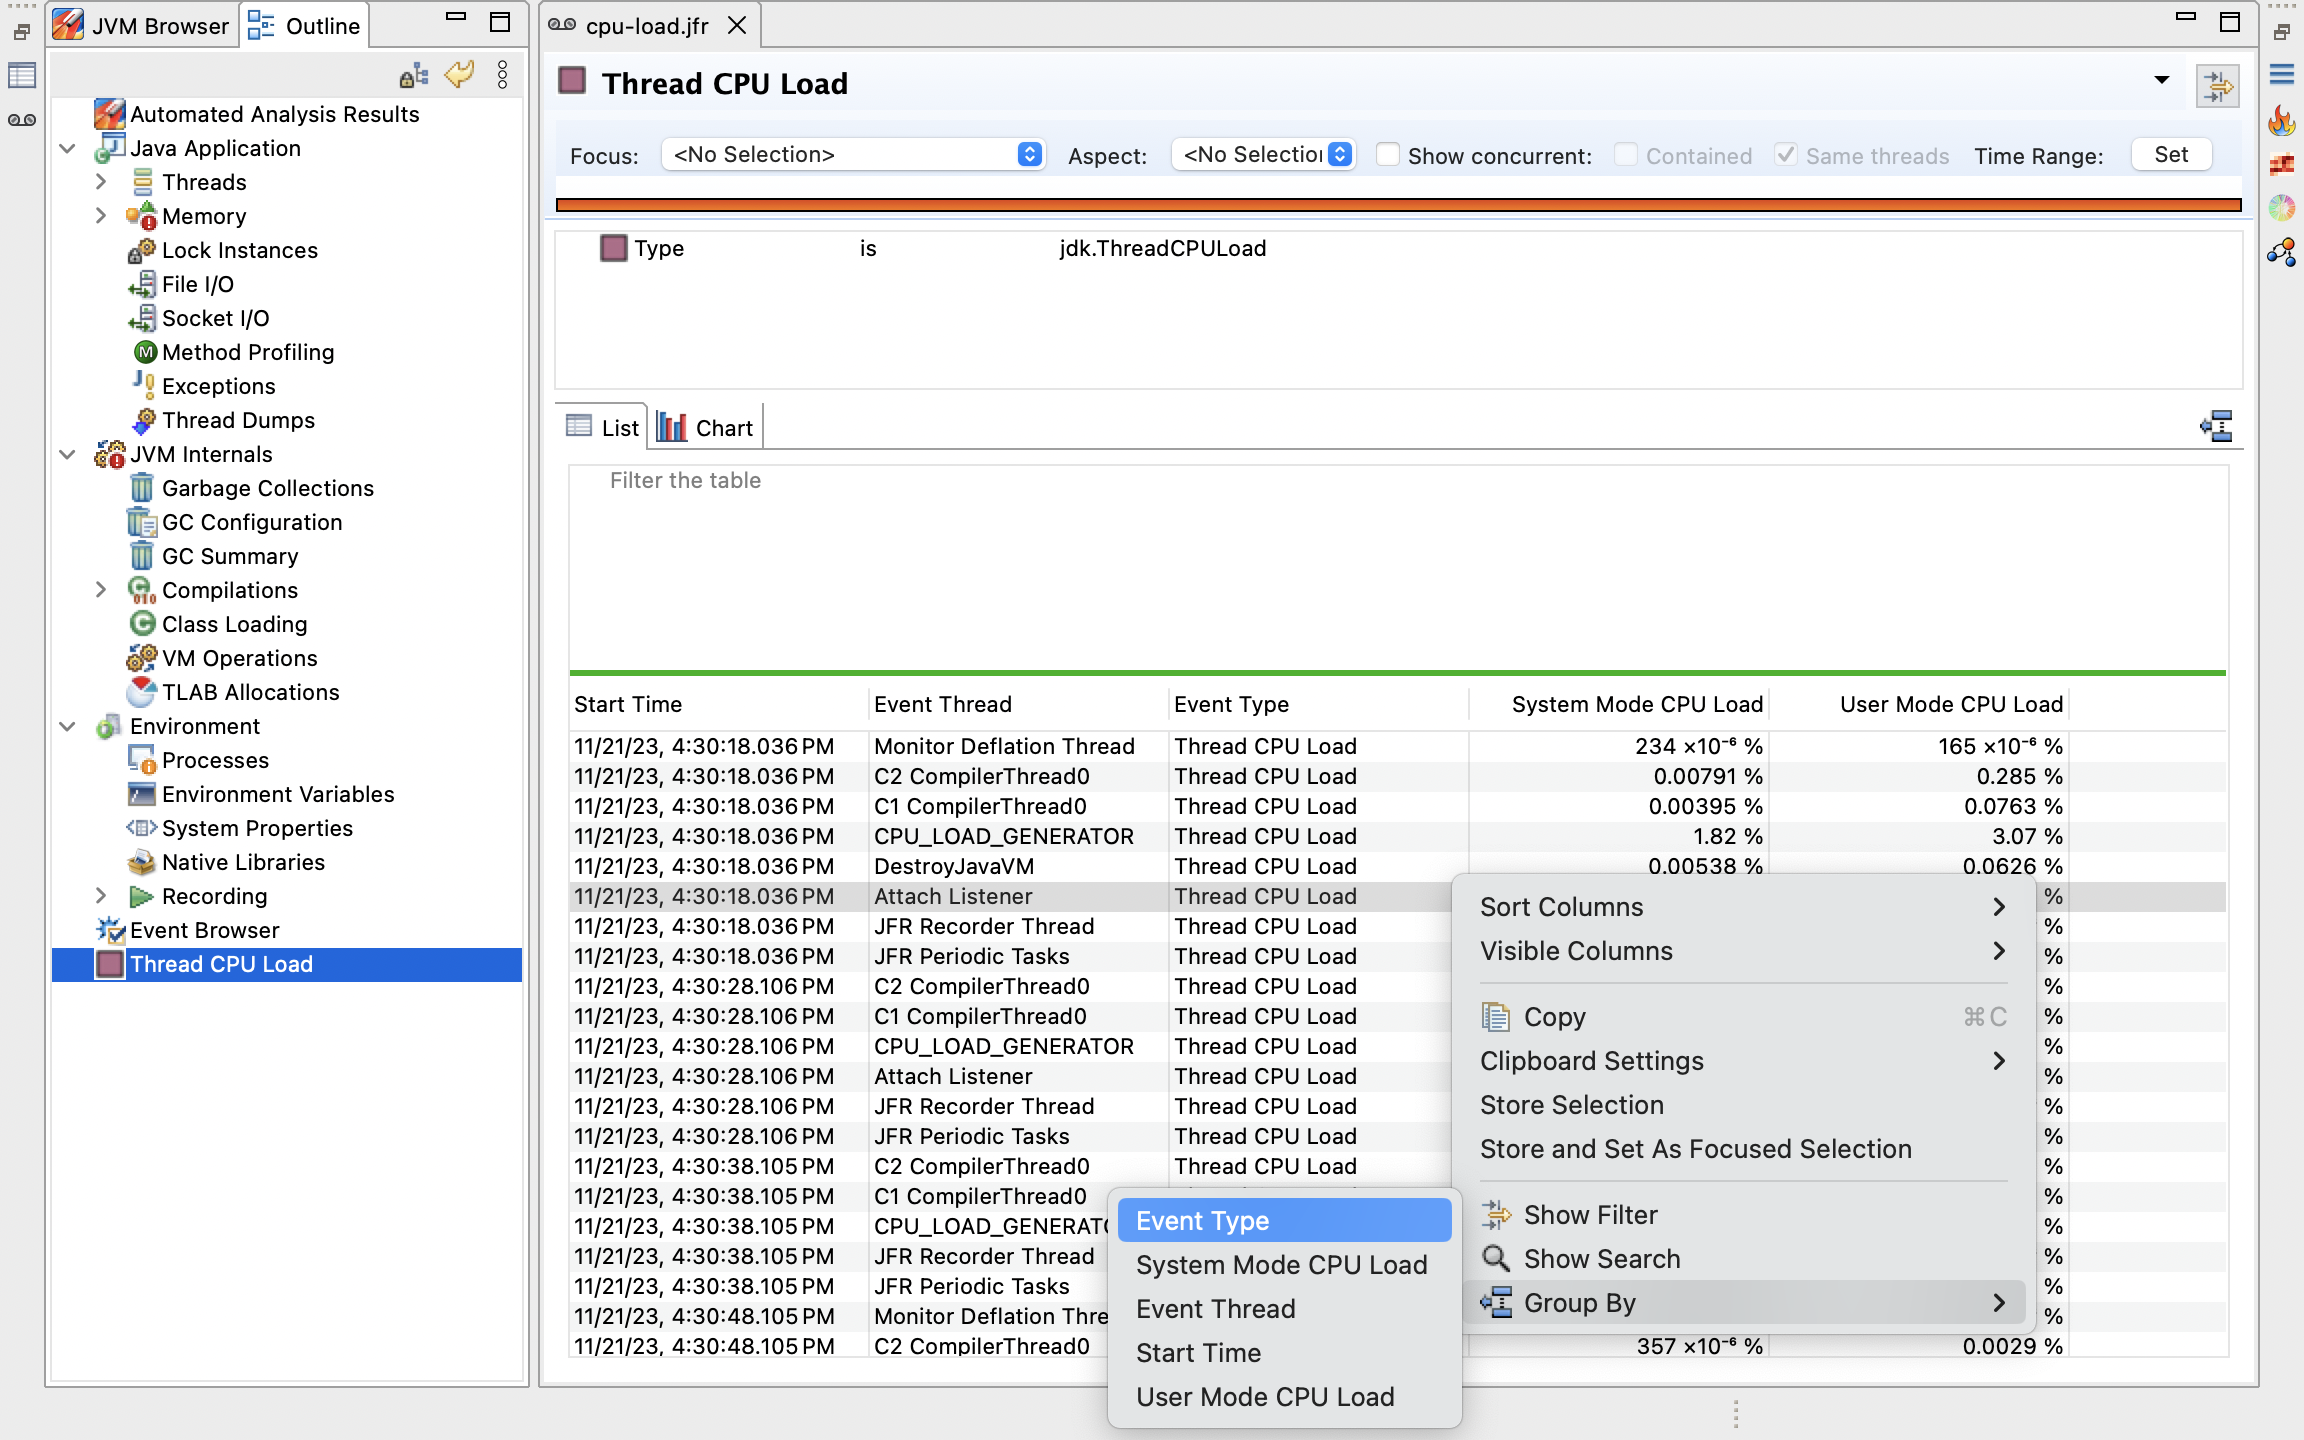
The percentages are based on the utilization of the total CPU. In my case, I have a 6-core hyperthreaded CPU, so the ~3% utilization represents about 50% utilization of one of the threads. In this example, I am running a simple endless Fibonacci sequence.
The jfr view command was added in JDK 21, allowing a much easier way of accessing this info directly from the command line!
With a recording, run the following command:
$ jfr view thread-cpu-load [recording-file]
And the table below will be printed:
                                Thread CPU Load

Thread                                                             System  User
------------------------------------------------------------------ ------ -----
CPU_LOAD_GENERATOR                                                  1.60% 3.29%
DestroyJavaVM                                                       0.01% 0.11%
JFR Periodic Tasks                                                  0.00% 0.00%
Attach Listener                                                     0.00% 0.00%
C1 CompilerThread0                                                  0.00% 0.00%
C2 CompilerThread0                                                  0.00% 0.00%
Monitor Deflation Thread                                            0.00% 0.00%
Service Thread                                                      0.00% 0.00%
JFR Recorder Thread                                                 0.00% 0.00%
Happy coding!