
Inside Java
News and views from members of the Java team at Oracle
News and views from members of the Java team at Oracle
ZGC, Java's highly scalable, low-latency garbage collector, was updated in JDK 21 to become a generational garbage collector with JEP 439. So, how do you use Generational ZGC? And what kind of performance will you get from switching to Generational ZGC? Let's take a look!
ZGC was initially released with JDK 11 as an experimental feature, and in JDK 15, it was upgraded to a production feature. ZGC was designed to be highly scalable, supporting heaps up to 16TB in size, while maintaining sub-millisecond pause times.
ZGC is able to achieve these goals by being almost entirely concurrent. This means that ZGC performs its work, allocating new objects, scanning for unreachable objects, compacting the heap, etc., while the application runs.
The tradeoff from this design choice is that applications have reduced throughput as CPU resources that the application could use are being utilized by ZGC instead.
A generational garbage collector logically separates the heap into two generations: a young generation and an old generation. When an object is allocated, it is initially placed into the young generation, which is frequently scanned. If an object survives long enough, it will be promoted to the old generation.
Generational garbage collectors perform this behavior to take advantage of the weak-generational hypothesis, which posits that most objects become unreachable shortly after they are created.
So ZGC, by frequently scanning the young generation, can be more efficient with CPU resources.
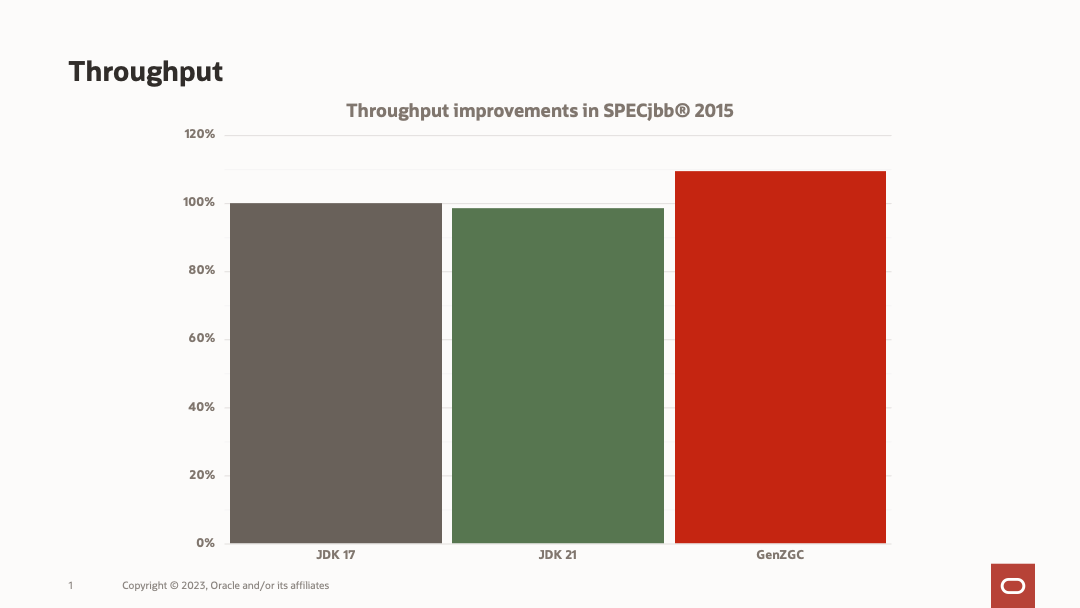
While developing Generational ZGC, the ZGC engineering team regularly ran internal performance tests to make sure Generational ZGC was meeting targets.
For throughput, Generational ZGC has about a 10% improvement over single-generational ZGC in JDK 17 and a little over 10% over single-generational ZGC in JDK 21, which saw a small regression.
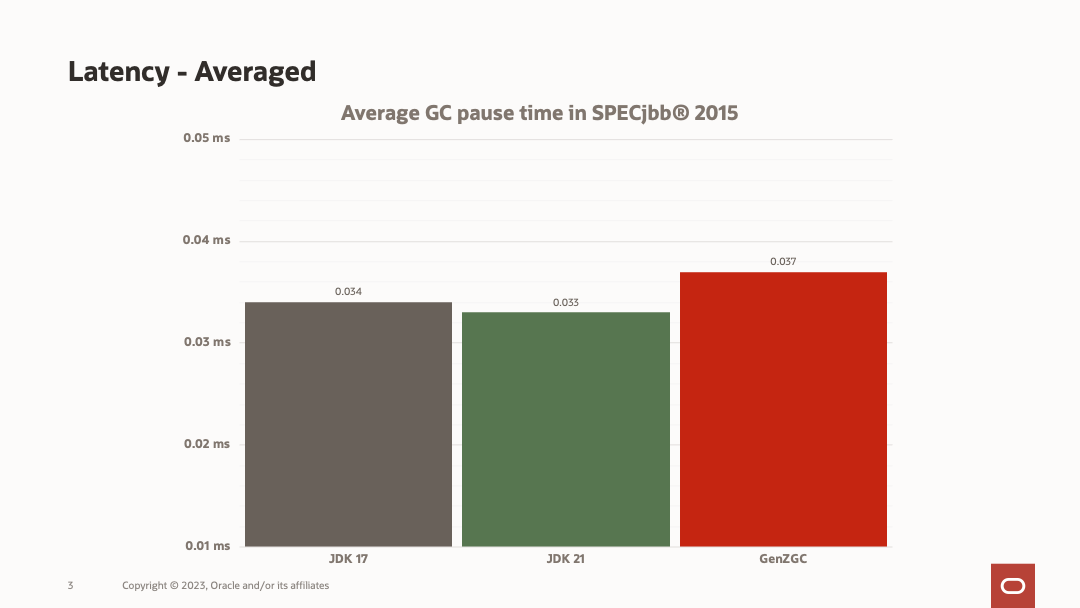
While this chart looks almost identical to the previous one, it tells a different story. This chart shows that Generational ZGC saw a slight regression in average latency when compared to single-generational ZGC.
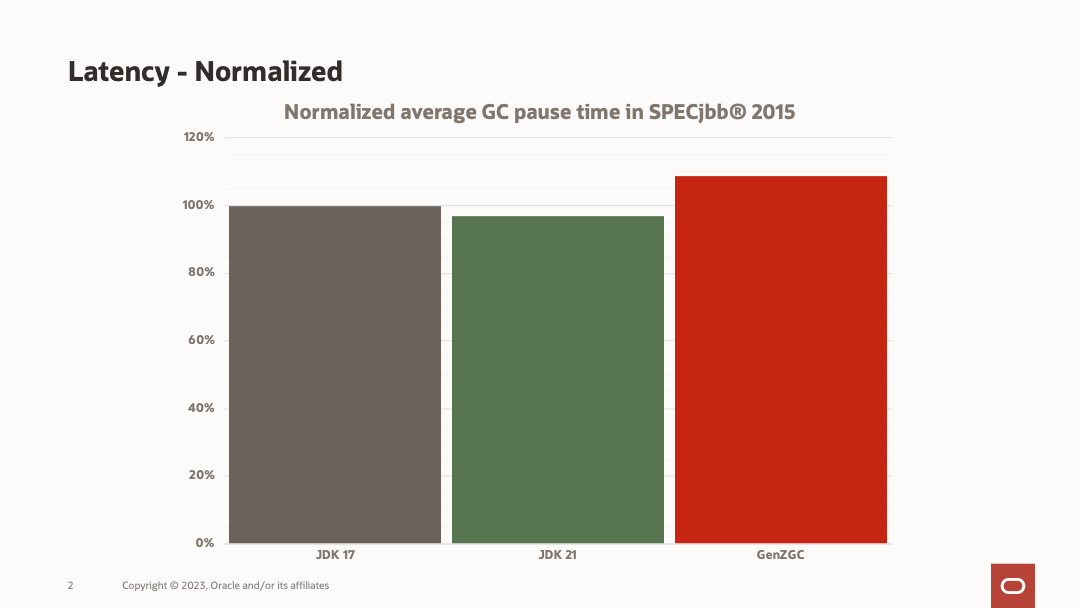
However, when we look at the actual numbers, we see the difference is only 2 to 3 MICROseconds.
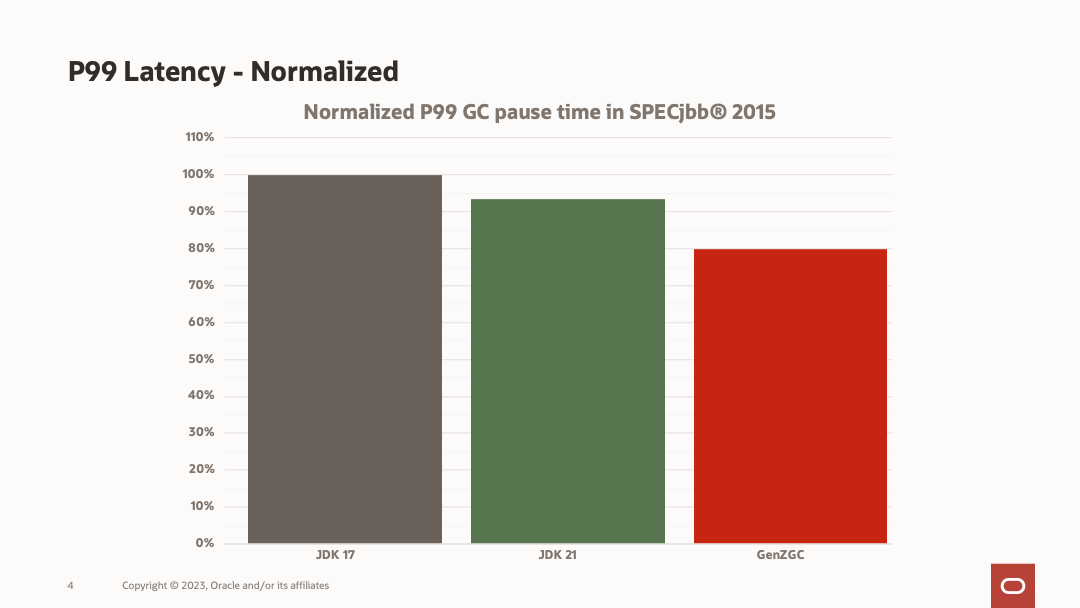
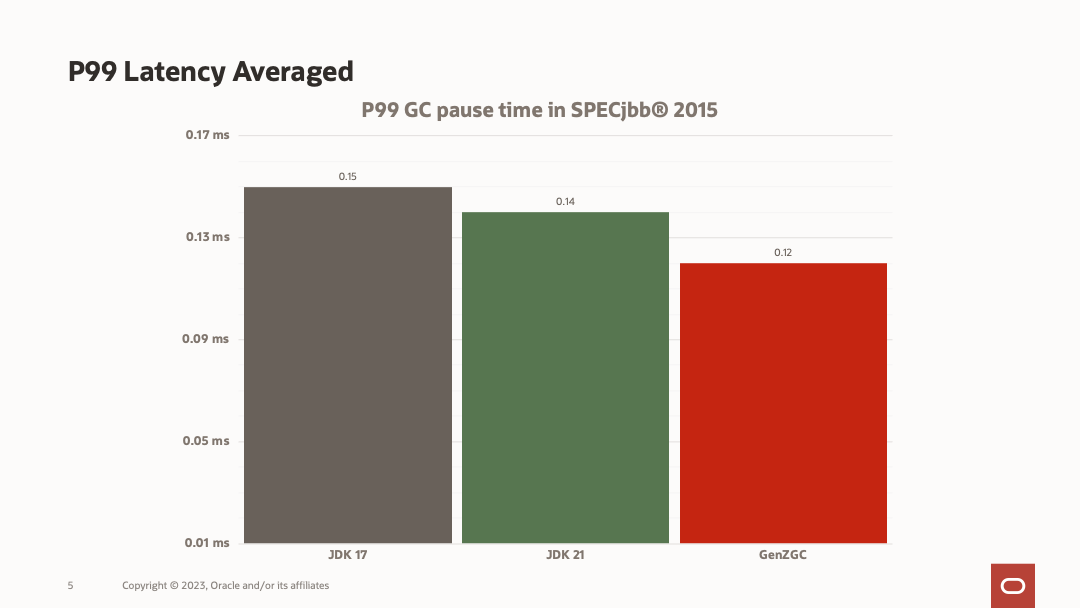
ZGC starts to shine when looking at max pause times. The charts below show a 10-20% improvement in P99 pause times, with a real number improvement of 20 and 30 microseconds over JDK 21 and JDK 17 single-generational ZGC, respectively.
Generational ZGC's biggest advantage is that it significantly reduces the likelihood of single generational ZGC's biggest issue, allocation stalls. An allocation stall is when the rate of new object allocation is faster than the rate at which ZGC can reclaim memory.
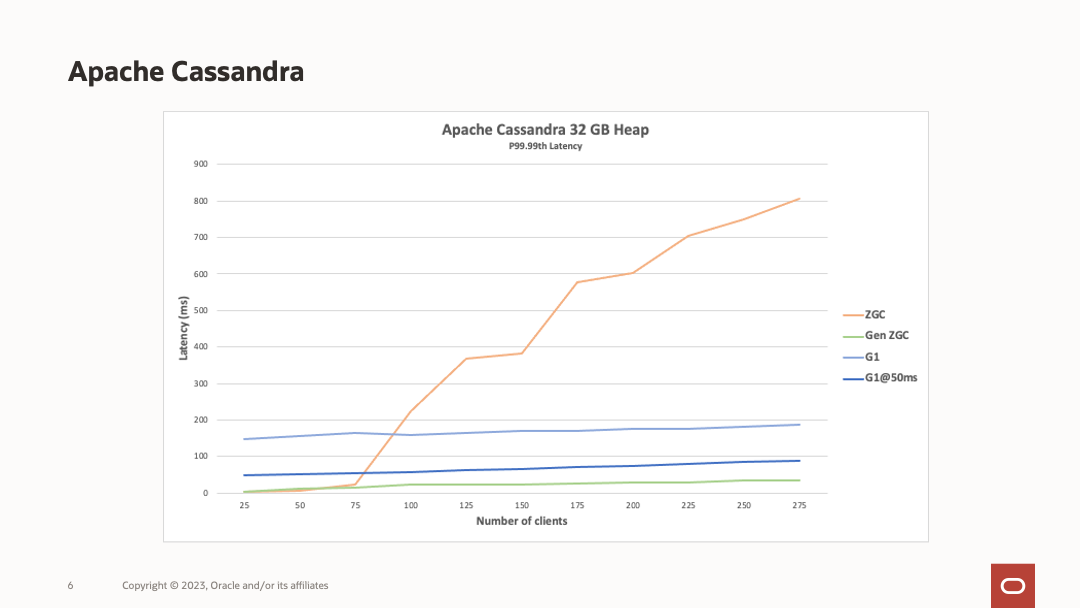
This issue can be seen if we switch the use case to Apache Cassandra and look at the 99.999th percentile. The chart below shows that up to 75 concurrent clients, single-generational ZGC and generational ZGC have similar performance. However, above 75 concurrent clients, single-generational ZGC becomes overwhelmed and runs into the allocation stall issue. Generational ZGC, on the other hand, doesn't experience this and maintains consistent pause times even with as many as 275 concurrent clients.
If you are interested in learning more about the allocation stall issue as well as Generational ZGC, be sure to check out Erik Osterlünd's JVMLS presentation on Generational ZGC.
Because implementing generational behavior into ZGC was a substantial change, the ZGC team set up a transition period from single-generational ZGC to Generational ZGC. In JDK 21, single-generational remains the default implementation when using ZGC, but eventually, Generational ZGC will become the default in a future release, with single-generation scheduled to be deprecated and then removed. However, the timeline for these steps has not yet been set.
With JDK 21 to use Generational ZGC requires the following two JVM arguments:
$java -XX:+UseZGC -XX:+ZGenerational
ZGC is designed to be self-tuning. In most cases, the only configuration the user should provide is max heap; -Xmx<size>. However there might be cases where additional configuration is needed; here are a few key configurations worth considering.
-XX:SoftMaxHeapSize=<size>: This argument provides a guideline heap size ZGC attempts to stay below. However, ZGC will go over this limit to avoid allocation problems. ZGC will attempt to get back under the SoftMaxHeapSize as soon as possible and return the memory to the operating system.
If your primary concern is latency, there are a few configurations worth considering:
Setting minimum heap size, -Xms, to the same value as mas heap -Xmx. This will stop ZGC from returning unclaimed memory to the operating system, which can cause latency.
-XX:-ZUncommit: Alternatively, this value can be used to disable returning memory to the operating system.
-XX:ZUncommitDelay=<seconds>: This manages how long ZGC will wait before returning memory to the operating system. The default is 300 seconds.
-XX:+AlwaysPreTouch: This moves the preparation of the heap to during startup. This will make startup a little slower, but at the benefit of reducing average latency.
Rather you are evaluating Generational ZGC to see if you want to switch to it or measure the impact of tuning changes, you must profile ZGC to assess it accurately. There are two primary ways of collecting diagnostic information about a garbage collector: GC logging and the JDK Flight Recorder.
Since JDK 9, using JVM logging has become more accessible while providing even higher-quality data. This is the result of two JEPs included in JDK 9, 158 and 271. This makes JVM logging a great option when evaluating GCs.
JVM logging is configured with the -Xlog argument, like in this example:
$ java -Xlog:gc:gen-zgc.log
This command would capture logging statements only tagged with gc and pipe them to the file gen-zgc.log.
For more extensive GC logging, you can use the following:
$ java -Xlog:gc*:gen-zgc.log
This command would capture all logging statements that include the gc tag. This command will also print out a table of GC statistics like in this example.
For more on JVM logging, be sure to check out the official documentation.
JDK Flight Recorder, JFR, is Java's observability and monitoring framework integrated directly into the JDK. For a deep dive on JFR, check out my StackWalker episode on it. There are several options for starting and configuring JFR; when evaluating a GC, you will likely want to enable it at startup with -XX:StartFlightRecording, like in this example:
-XX:StartFlightRecording=filename=gen-zgc.jfr,settings=profile
This would write JFR data to gen-zgc.jfr and use the profile settings, which have sub-2% overhead. Alternatively, default settings could be used, which has sub-1% overhead, as well as custom settings.
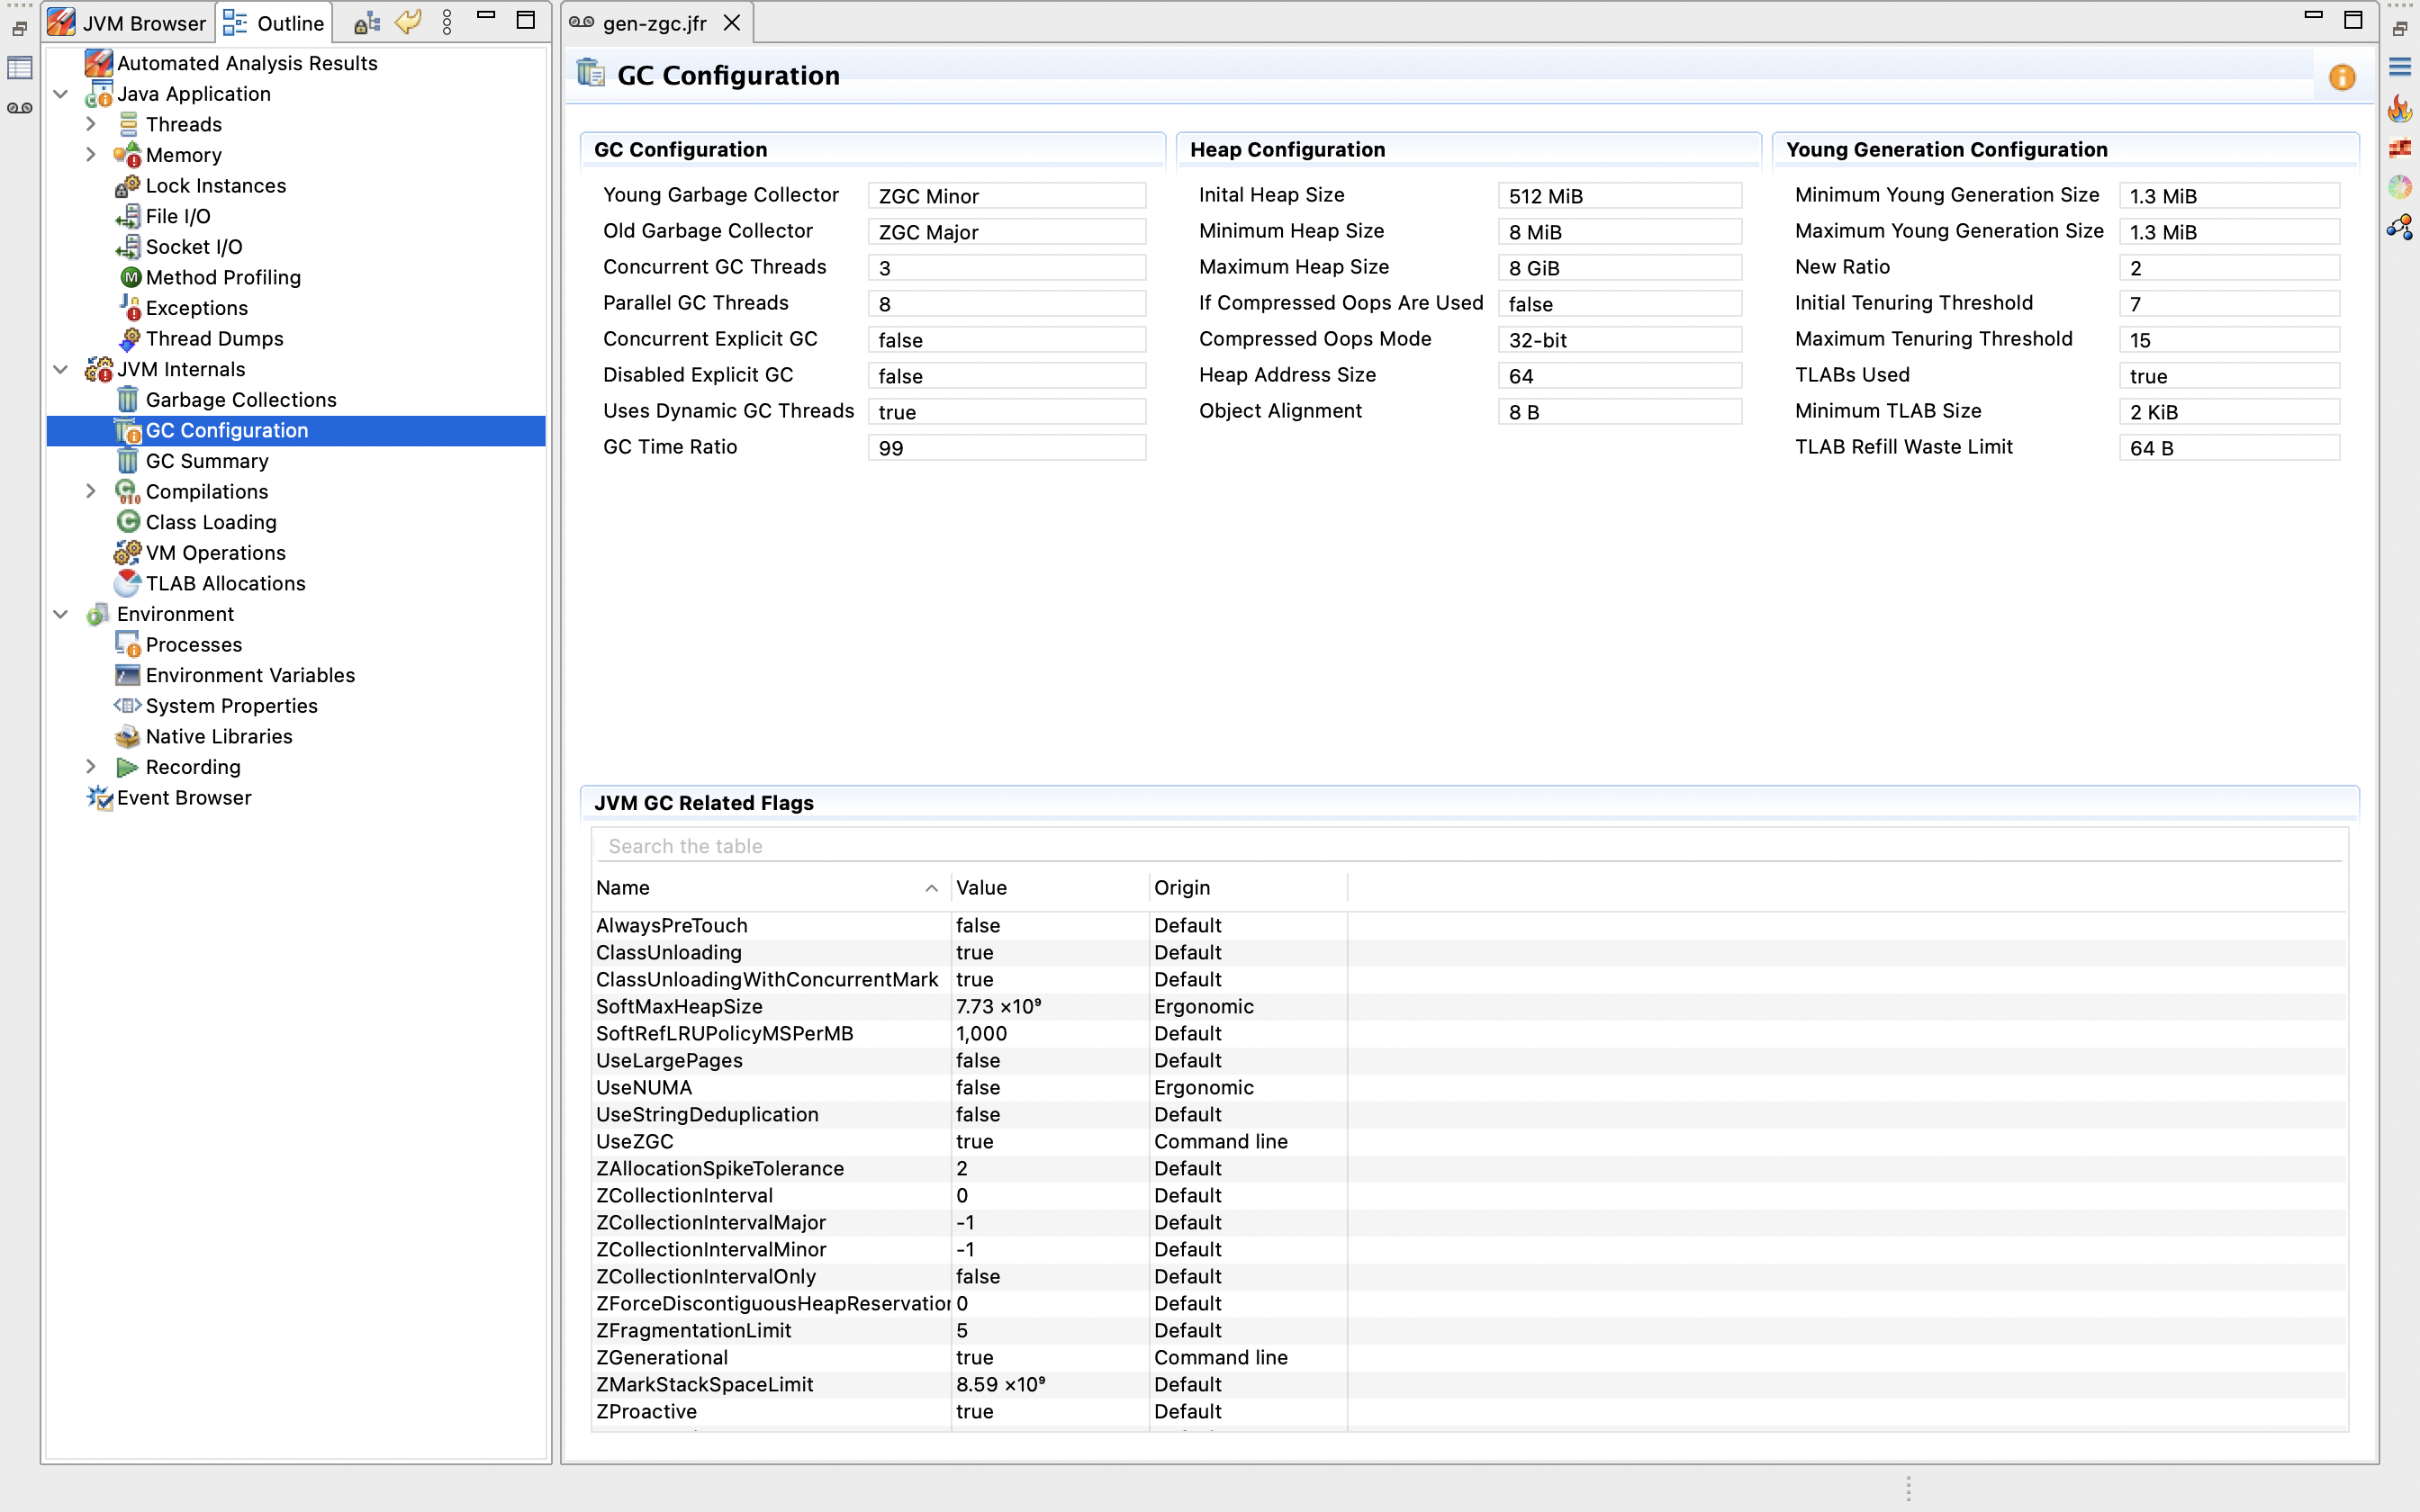
Once JFR data has been collected, it can be evaluated in JDK Mission Control (JMC). JMC several provides tabs for evaluating GC behavior, including an overview of garbage collections, GC configurations, and an overall summary of GC behavior:

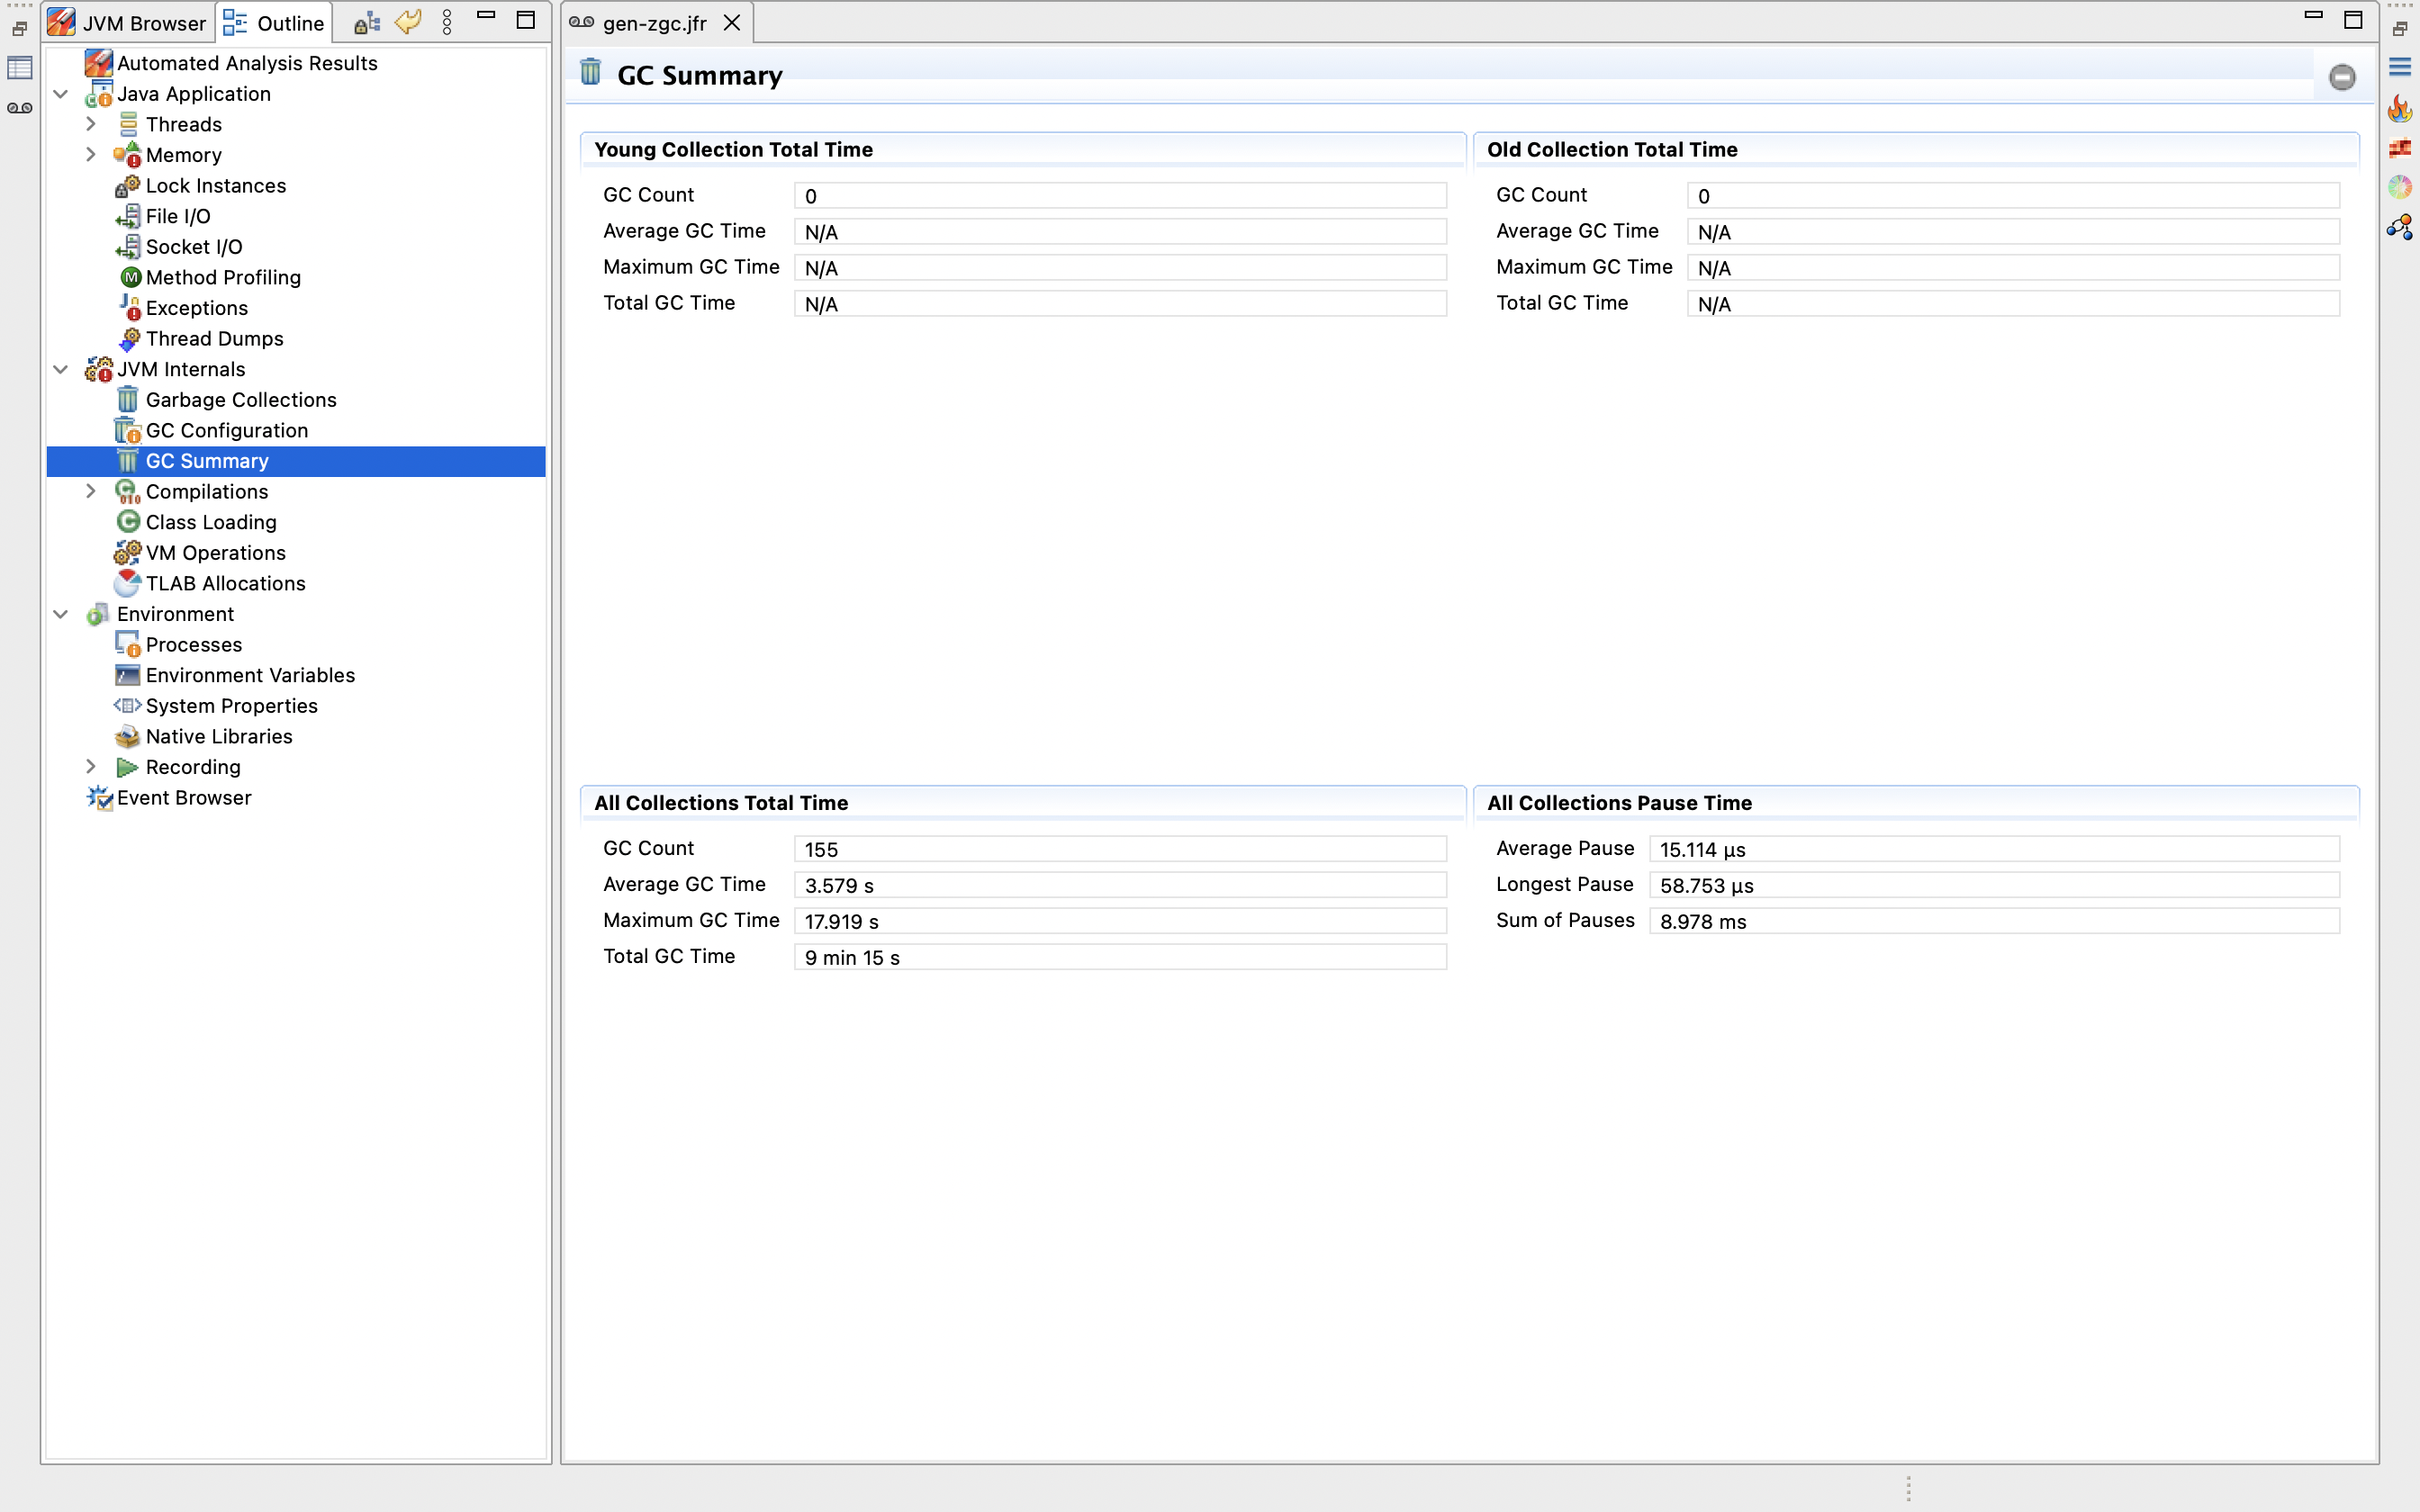
Note: Some of the summary page information might seem a little off; there's an active discussion among the Generational ZGC and JMC developers on best represent young and old garbage collections in Generational ZGC.
Generational ZGC will make ZGC a great option for even more Java applications. ZGC provides scalability and ultra-low latency, and with the addition of generational capability, the allocation stall issue has largely been resolved. When upgrading to JDK 21, take the opportunity to evaluate Generational ZGC to see if it's the right option for your Java applications.