
Inside Java
News and views from members of the Java team at Oracle
News and views from members of the Java team at Oracle
Cloud native adoption is now mainstream. Kubernetes usage in production has soared to 82% among container[1], and Java applications constitute a substantial share within those clusters. As Kubernetes adoption continues to grow, the need for monitoring, managing and observing Java applications in containers have become more crucial...
In cloud-native architectures, services are typically decomposed into many microservices running across multiple pods. As a result, effective troubleshooting and performance analysis depend on correlating telemetry data (logs, metrics, and traces) across services and performing cross-JVM analysis to diagnose bottlenecks.
While managed Kubernetes platforms provide infrastructure-level metrics such as CPU, memory, logs, and pod health, they do not natively expose JVM-level diagnostic data. JDK Flight Recorder (JFR) is a JVM specific tool that provide these diagnostics such as garbage collection behaviour, allocation profiling, lock contention, safe point analysis, CPU profile shifts, and thread state transitions.
Java Management Service (JMS) in OCI leverages the JFR capabilities to address this gap by providing secure, fleet-scale orchestration of JFR across distributed Kubernetes environments.
Traditional approach to get JVM diagnostics is by accessing the running JVM directly via JMX or command-line tools like jcmd. However, modern microservices architecture introduces following complexities:
Services run across hundreds or thousands of pods.
Containers are ephemeral.
Direct shell access is restricted.
JMX ports are restricted due to security and compliance policies.
These complexities introduce several operational challenges:
Orchestration of JFRs across hundreds of distributed JVM instances demands a scalable and centralized management approach capable of operating reliably in dynamic Kubernetes environments.
A recording mechanism that is resilient to pod lifecycle events.
Large scale storage coordination- for example, capturing 24 hour recording with an average size of 1-2 GB per pod across 100 pods results in approximately 200 GB of diagnostic data.
Direct shell access is often restricted, and exposing JMX endpoints for profiling increases the security surface area.
Slim JRE builds or jlink-generated runtimes, which may limit the availability of diagnostic utilities within the container.
JMS, an OCI native service, provides monitoring and management for Java workloads. It extends OCI observability by enabling secure, scalable JFR captures across Kubernetes clusters without exposing the JMX endpoints or requiring direct container access. It is implemented as a plugin to the Oracle Management Agent (OMA)[3] and key capabilities includes:
Discovery of JVM running inside Kubernetes
Identification of runtimes below defined security baselines
Fleet-wide JFR recordings across pods
JFR recording scheduler
Secure export of JFR Recording to an OCI object store
Integration to JMS advanced features using JFRs
Performance improvement recommendation to fine tune JVM Parameters
Detection of deprecated cryptographic algorithms in Oracle JDK
JMS enables centralized capture of JFR recordings from a specific container or across selected application containers within a cluster. Through the JMS console or APIs, administrators can select the target workload, configure recording parameters, and initiate a JFR capture request. Upon completion, the recordings from each container are automatically exported to the designated Object Storage bucket. These recordings can then be analysed to diagnose performance bottlenecks, optimize resource utilization, and gain actionable insights into Java application behaviour.
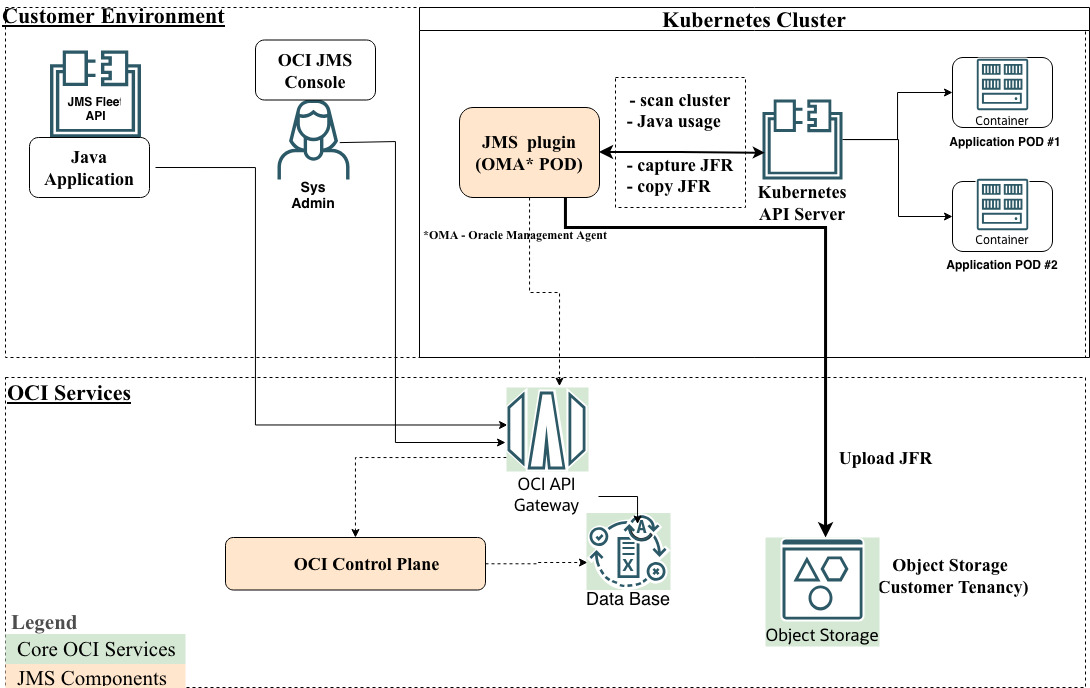
Figure 1: Architecture Overview
JMS integrates with the Oracle Management Agent (OMA) service, which is deployed in the Kubernetes cluster using the OCI Kubernetes Monitoring Solution[2]. The JMS plugin runs within the OMA pod and interacts with application pods to collect Java telemetry data and perform JFR operations.
The JMS plugin communicates with the JMS service running in OCI to transmit telemetry data and manage JFR capture requests. Using Kubernetes client APIs, the plugin discovers Java workloads in the cluster, retrieves Java runtime usage details, and executes commands within the application containers to start and stop JFR recordings. The captured telemetry and JFR data are sent securely to JMS service and Object storage respectively. The JMS console displays this data, providing insights into Java runtime versions and application details across the Kubernetes environment.
Administrators can monitor Java application in active containers and trigger or schedule JFRs.
Operational workflow:
Onboard the Kubernetes cluster to JMS
Discover active Java containers
Identify Java runtime versions below security baseline
Trigger JFR with single click
Export recordings for analysis using tools such as JDK Mission Control
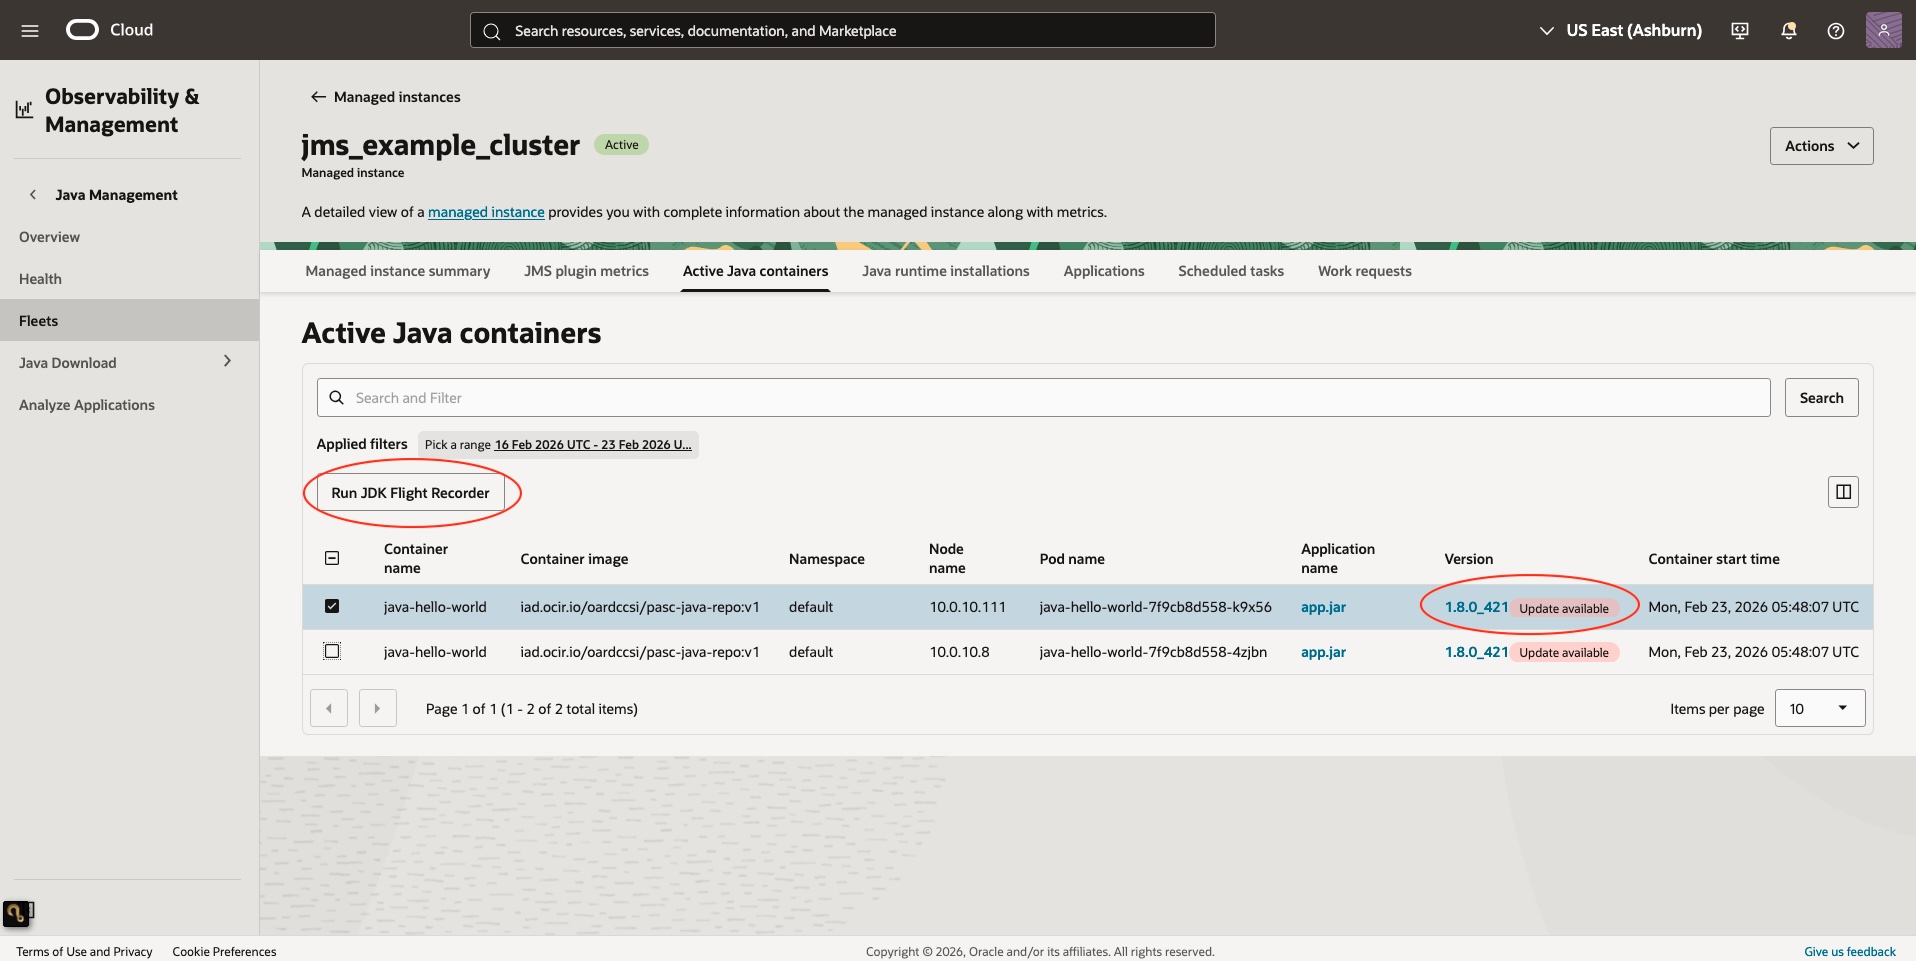
Figure 2: JMS Console displaying active Java containers and JFR controls
In case of an incident, administrators can trigger JFR across all replicas in a single action during live production troubleshooting.
JMS can be integrated with OCI Monitoring to trigger JFR based on real time Kubernetes metrics.
Operational workflow:
Pre-configure rules based on desired Kubernetes metrics into OCI Monitoring service
OMA collects Kubernetes metrics (example CPU/memory)
OCI Monitoring evaluates threshold rules
OCI Alarm is triggered when thresholds breach
OCI Function processes the events
JMS APIs triggers JFR on impacted load
(Phase enhancements are planned to reduce trigger latency (~ 10 minutes) for near-immediate recordings)
Automatically capture JFR for a fixed duration after each production deployment and detect performance regression early.
Operational workflow:
Integrate JFR recordings in production using automation
Compare CPU profile shifts, Allocation rate
Validate behavioral consistency against baseline
Run JFR for 48–72 hours after and compare allocation rate, thread states, blocking time, CPU profile shifts. This reduces MTTR and prevents regression from surfacing an alert noise.
As Kubernetes adoption accelerates, infrastructure-level observability is no longer enough for Java workloads. Organizations need secure JVM intelligence embedded into their cloud operations model. With JMS, OCI provides a centralized framework for Java runtime governance and fleet-scale JFR orchestration across cloud native environments.